A large number of demonstrations of electromagnetic radiation are
possible with the Microwave Optica Kit. Accompanying this kit is a
large wall chart which is depicted on the next page and which aids in
explanation of many of the demonstrations. Typical
experiments which can be performed with the kit include transmission of
microwaves and field configurations in waveguides, feed horn patterns,
wavelengths in waveguide and free space, beam reflection and
refraction, standing waves, interference, diffraction. These and many
more are described below. A diagram of the kit labeling its various
components is given on the next page, following which the initial
turn-on instructions and descriptions of the components is given.
Chart of Electromagnetic Radiation
Diagram of Microwave Optics Kit
OPERATING INSTRUCTIONS
At
the extreme left of the kit is the power supply, indicating meter and
audio unit. Next to it is the main waveguide containing the klystron,
variable flap attenuator, the frequency meter and the sliding probe on
the slotted waveguide section. The electronic box with meter contains a
regulated power supply for the klystron, audio modulating voltages, and
a high gain audio amplifier. These components are described in more
detail in the next section. Be sure that the klystron is firmly seated in the tube socket by applying moderate pressure to its upper portion.
Turn-On Procedure
With the "Repeller Voltage" in the OFF position, plug in the power cord to a 115 V, 60 Hz outlet.
Set the "Audio Volume" to OFF.
Set the "Electronic Tuning" to OFF.
Turn the "Repeller Voltage" clockwise to turn on the unit, then wait one minute for warm-up.
Place the Variable Flap Attenuator at 30db.
Place the Frequency Meter to its maximum closed position by
GENTLY turning the micrometer to its maximum clockwise position
(looking down).
Loosen the locking screw on the Sliding Probe and place the probe at its extreme right hand position on the parallel rails.
With the rib side up, attach one of the small waveguide horns
to the end of the waveguide. This is referred to as the transmitting
horn. (The screws should be finger tight; two screws are adequate for
most experiments.)
Attach the other horn to the crystal detector in similar
fashion. This is the receiver horn. Attach the coaxial cable to the
receiver assembly.
Set the Variable Flap Attenuator to 12db, and slowly turn the
Repeller Voltage knob through its entire range noting the meter
indications. Place it in the position which gives maximum reading. The
adjustment is quite sensitive. If the meter goes off scale (above 100),
too much power is being used and the life of the crystal will be
shortened. Reduce the power by adjusting the attenuator to a higher db
level to give a meter reading of 50.
To operate the audio circuitry, turn the "Audio Volume" switch to its ON position and adjust volume.
When modulation other than the 1000 Hz internal audio
signal is desired, it can be connected on the rear of the cabinet at
the jack labeled "EXT. MOD." The received audio can be displayed on an oscilloscope at the OUTPUT jack. The crystal detector can be placed on a tripod and moved about the room for some experiments. A
circuit breaker in the primary of the transformer will open if an
overload occurs. Wait for the breaker to close again, then push the red
reset button at the rear of the cabinet. If it quickly reopens, the
cause is probably a defective klystron and replacement klystron should
be used.
DESCRIPTION OF COMPONENTS
Electronic Cabinet The cabinet at the extreme left of the
base contains the power supply, amplifier, meter and other electronic
instrumentation required to operate the kit. The meter on the face of
the cabinet is used to measure power, attenuation and voltage standing
wave ratio (VSWR) in the various experiments. The AUDIO VOLUME control
sets the level of an audio signal which is proportional to the meter
reading. The frequency of the audio signal can be set at either 1000 or
60 Hz by means of a switch at the rear of the cabinet. The ELECTRONIC
TUNING dial selects the frequency of the microwaves, which can be tuned
continuously between 9.4 and 10.0 GHz. See experiment 19 for details on
tuning the KLYSTRON. The REPELLER VOLTAGE dial adjusts the power output
of the klystron which a maximum output of 10 milliwatts. A CIRCUIT
BREAKER is located at the rear of the cabinet and will open if an
overload occurs. Jacks are located at the rear of the cabinet for
external modulation and for using an oscilloscope with the kit.
Klystron The klystron is used to generate the
microwaves. It receives low frequency energy from the power supply and
converts it to microwave energy. The microwave energy is transmitted
into the waveguide by an antenna attached to the cavity of the klystron
and protruding into the waveguide from the bottom of the tube. For more
details see Experiment 19, Tuning the Klystron.
Variable Flap Attenuator This is used for the power
level in the microwave system. Energy incident on this card causes it
to be heated and dissipate wave energy. The greater the penetration of
the card into the r.f. field, the greater the dissipation of energy and
the attenuation. The attenuator is calibrated in decibels, i.e.,
db of attenuation = 10 log10(Pi/Po)
where Pi = power input and Po power output.
Frequency Meter
The frequency of the transmitted signal is measured by a cavity
wavemeter and indicated on the frequency meter. It is measured by
absorption of the r.f. energy which is coupled through a hole in the
waveguide into the cavity. The size of the cavity is adjustable by a
micrometer screw whose readings are converted into frequency. Details
are given in experiment 18.
Slotted Line and Sliding Probe This component is
provided in order to make measurements of the standing waves and
investigate the characteristics of the field in the waveguide. Energy
does not radiate through the slot because it is positioned exactly in
the middle of the broad wall where there are no transverse currents,
and where it does not disturb the waveguide modes. The probe has a
pick-up antenna in the waveguide energizing a microwave diode mounted
above the slot. As the probe is moved along the slot, the intensity of
the r.f. electric field is seen to go from a maximum to a minimum in
sinusoidal fashion. By measuring the distance between successive maxima
or minima, the wavelength of the signal in the waveguide can be
obtained. In addition, the Voltage Standing Wave Ration (VSWR) can be
measured in this way, as is described in Experiment 7.
Waveguide Horn
Horns are provided in order to match the impedance of the waveguide to that of air and to direct the radiated energy.
Waveguide Crystal Detector This component detects
the received power. The signal is picked up by a crystal diode which
ultimately produces an audio signal and a deflection on the meter. This
diode is a solid state device which converts the r.f. energy to a D.C.
voltage. The r.f. energy cannot be measured directly on a meter, so it
is rectified by the action of the diode to a pulsating D.C. voltage.
The current through such a diode is proportional to the square of the
potential across it, therefore, the meter indication is proportional to
the intensity of radiation and the relative power level.
DEMONSTRATIONS
The following is a list of some
possible demonstrations. Many of these are explained on the "Chart of
Electromagnetic Radiation".
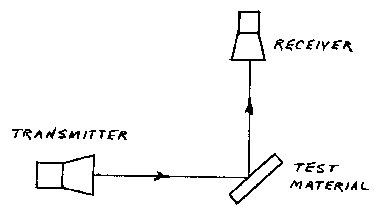
Reflection by Insulators Place the small gain horns on
the transmitter and receiver, attach the coaxial cable to the receiver
assembly and place the receiver at the 25 cm mark on the long scale.
Adjust the attenuator to give a meter reading of 80. Now move the
receiver on the board to a position a shown below. Insert a test
material as shown and note the effect. The test material can be wood,
cardboard, cloth, wet or dry sponge, glass, etc.
Reflection by Conductors Same demonstration as #1,
except test materials are metal sheets, mirrors, etc. Note the
difference in the effect between experiments #1 and #2.
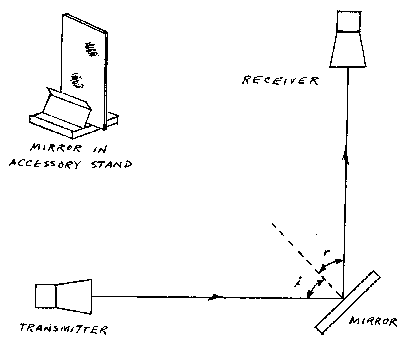
Law of Reflection With the small gain horns on the
transmitter and receiver and the coaxial cable attached to the
receiver, place the receiver at the 25 cm mark and adjust the variable
flap attenuator to give a meter reading of 80. Insert the mirror in the
accessory stand and position it and the receiver on the board as shown
in the diagram below, with the mirror opposite the 13 cm mark. Starting
with the mirror at a 90ş angle to the direction of propagation, slowly
rotate it toward the receiver until a maximum on the meter is observed.
At this point, one can verify that the angle of incidence equals the
angle of reflection.
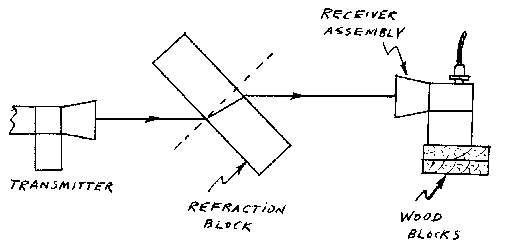
Refraction With the small gain horns on the
transmitter and receiver and the coaxial cable connected to the
receiver, place the receiver at the 25 cm mark and adjust the variable
flap attenuator to give a meter reading of about 60. Keeping the
horizontal distance between the horns constant, elevate the receiver
assembly about one inch by placing it on a wood block. Note the meter
reading in this position. Now place the refraction block between the
horns as shown below and note the increase in the meter reading.
Polarization
Place
the receiver along the graduated scale and insert the analyzer grid
between the transmitter and receiver with the slots horizontal. Slowly
rotate the analyzer about a horizontal axis and note the meter
indication. Now
place the slots horizontal but with the plane of the grid at an angle
to the centerline, as in the diagram in experiment 3. Vary this angle
by rotating the grid about a vertical axis, and note the meter
readings. Repeat the experiment with the slots in the grid vertical.
AttenuationPlace the receiver along the graduate scale
and decrease the attenuator in steps to check the meter readings versus
the equation db = 10 log10(P/Po).
VSWR Measurement
VSWR is the ratio of the maximum voltage of the transmitted waves to
the reflected waves in the waveguide. Reflected waves are undesirable
since they cause a decrease in the output power. A perfect transmission
line has no reflected waves, however, real waveguides have both
mechanical and electrical mismatches. The VSWR gives a picture of this
mismatch to which microwave devices are very sensitive. Connect
the coaxial cable to the pin-jack on the sliding probe. Start at the
extreme right end of the slotted line and slide the probe along its
rails noting the meter deflections. Adjust the attenuator to give a
meter deflection of 100 at a maximum. Move the probe to a minimum and read the VSWR on the lower scale of the meter. Repeat the experiment with a mirror placed over the transmitting horn.
Transmission in Rectangular Waveguide
The field patterns in the waveguide are shown on the "Chart of
Electromagnetic Radiation". Place the receiver at the 24 cm mark and
attenuator at 20 db. Insert the piece of rectangular waveguide between
the horns with its broad and narrow walls in the same planes as the
broad and narrow walls of the main waveguide. Note the effect.
Cut-Off in Rectangular Waveguide This demonstration
is the same as #8, except that the piece of rectangular waveguide is
rotated about the horizontal axis of the waveguide by 90ş so that its
narrow walls are in the same plane as the broad walls of the main
waveguide. The result illustrates that cut-off occurs in the waveguide
when the dimension of the waveguide perpendicular to the electric field
vector is less than one-half wavelength.
Electromagnetic Field Configuration in Rectangular Waveguide Place
the receiver along the graduated scale at the 21 cm mark. Place the
attenuator-phase shifter card into the accessory stand with the
attenuator up, and slide the stand along the graduated scale toward the
transmitting horn. The tapered end of the attenuator will enter the
transmitting horn to the point where the white support touches the lip
of the horn. Taking care not to interrupt the r.f. field, slide the
stand across the horn from one end to the other. The meter should go
form a maximum a tone side to a minimum at the center to a maximum at
the other side.
Transmission in Circular Waveguide The field
configurations in circular waveguide are shown on the Chart of
Electromagnetic Radiation. To demonstrate propagation in this type of
waveguide, place the receiver at 24 cm and adjust the variable flap
attenuator to obtain a meter reading of 20. Insert the large diameter
waveguide between the horns and observe the effect.
Cutoff in Circular Waveguide
Same as demonstration #11, except small diameter circular waveguide is used.
Transmission in Dielectric Waveguide
Same as demonstration #11 except circular plastic waveguide is used.
Changing Direction of Transmission Path Substitute
the 90ş waveguide bend for the transmitting horn connecting the
unthreaded flange to the main waveguide so that the bend points toward
the back of the board. Connect the transmitting horn to the threaded
flange of the waveguide bend. To investigate reflections due to the
bend, perform the VSWR measurement as in demonstration #7 and compare
the results.
Gain Horns (Impedance Matching) Two types of gain
horns are supplied with the kit. The small horn gain is 8.4 db and the
gain of the large horn is 18 db. Hence, the directivity of the larger
horns is much better as well as being able to transmit over longer
distances. In addition, the impedance match between the waveguide and
free space is improved with the large horn. To
illustrate impedance matching, disconnect the horn from the transmitter
and measure the VSWR of the main waveguide without a horn as described
in experiment #7. Repeat the experiment with each of the gain horns
attached and compare the results. (High VSWR indicates high impedance
mismatch.) This can also be shown with the receiver. With the small
horns on the transmitter and receiver, place the receiver at the 23 cm
mark. Connect the coaxial cable to the receiver. Set the meter at zero
db using the variable flap attenuator. Then, remove the horns, move the
receiver to the 12.5 cm mark (same distance between aperatures) and
note the difference.
Long Range Transmission (Inverse Square Law, Near Field and Far Field Effects) In
the far-field (or Fraunhofer) region, the intensity of the radiation
emitted by the horn decreases inversely as the square of the distance
from the Horn. Closer to the horn in the near-field region (or Fresnel
Zone) the decrease is not as rapid. The Fresnel zone extends to a
distance of about 2D2/l from the horn where D is the effective aperature of the horn (D = 2.5 cm for a small horn, D = 10 cm for the large horn). To
demonstrate these effects, connect the small horns to the instrument
and place the receiving horn 1 cm from the transmitting horn. Adjust
the attenuator to give a meter reading of 100% (0 db). Move the
receiver to the other separations (2 cm, 4 cm, etc.) and record the
meter readings. Repeat with large horns but start at a separation of
10 cm and move to 20 cm, 40 cm, etc. It will be necessary to place the
receiver on a tripod.
Gain Horn Patterns Attach the 90ş waveguide bend to
the transmitter and the high-gain horns to the transmitter and
receiver. Place the receiver on a tripod. At a distance of about 8
feet, align the horns as to line-of-sight and height. Vary the
horizontal angle of the receiver assembly so to maximize the meter
reading. Call this point 0ş and adjust the attenuator to give a meter
reading of 100. Turn the receiver through +/- 20ş recording meter
readings at increments corresponding to changes of 10% in level. Record
readings and their corresponding angles and plot results on a polar
plot. Repeat for small horns at a spacing of 3 feet.
Frequency Measurement
The micrometer screw on the board adjusts the length of a right
circular cylinder which acts as a cavity resonator. It can be used to
measure the frequency of the microwave radiation as follows. Adjust
the attenuator to give a reading of about 80 and slowly turn the
micrometer barrel from its maximum position. At the point where a dip
in the output occurs, move the micrometer screw back and forth to
establish the minimum reading. Record this reading and look up the
frequency in the chart supplied with the instrument. Be sure that the
Electronic Tuning knob is OFF when doing this measurement.
Tuning the Klystron The size of the klystron cavity
and, hence, its operating frequency can be changed by the Electronic
Tuning control. This control causes heating of a bimetallic bow which
is connected by rods to the klystorn cavity. To change the operating
frequency of the klystron, turn the control on and set at the desired
frequency on the dial, wait one minute for stabilization and adjust the
repeller voltage for maximum output. Measure the frequency with the
cavity frequency meter.
Wavelength in Free Space Remove the coaxial plug
from the receiver and connect to the sliding probe. Position the
receiver assembly at the 14 cm mark. This will act as a reflector to
set up standing waves in the waveguide. Adjust the attenuator to give a
meter reading of about 60. Move the receiver to the right to a minimum
of the meter, then continue to the next minimum. The difference in the
scale readings at these two minima is equal to one-half the wavelength
of the microwave radiation infree space.
Wavelength in Waveguide
The wavelength in the waveguide, lg, is related to the wavelength in free space, l, by
lg = l / ( 1 - (l/2a)2 )1/2
where a = broad wall dimensions of waveguide = 2.286 cm. To measure the wavelength lg,
connect the coaxial cable to the sliding probe, remove the transmitting
horn and clamp the analyzer grid with the slots vertical to the end of
the waveguide. This acts as a reflector to set up standing waves. Slide
the probe along the slotted line to locate a maximum, at which point
adjust the attenuator to give a meter reading of 100. Then find the
distance between two successive minima by sliding the probe along the
slotted line and observing the meter readings. This distance is equal
to one-half the wavelength lg. Verify this result by substituting l as found in experiment 20 into the above equation. The experiment can be repeated at different frequencies by tuning the klystron as described in experiment 19.
Phase Shift
Insertion of dielectric material into the waveguide can cause a phase
shift in the wave pattern in the slotted line. This phase shift can be
measured as follows. Attach
the coaxial line to the sliding probe, adjust the attenuator to give a
meter reading of 60, and position the receiver at 14 cm on the long
scale. This acts as a reflector to set up standing waves. Measure the
wavelength as described in experiment 21. Then move the probe slowly
from left to right and locate the position of the first minimum. Insert
the phase shifter laterally into the extreme right hand end of the
slotted line, and locate the new position from 2px/lg where x = the separation of the minima found with and without the phase shifter in the slotted line.
Single-Slit Diffraction
To demonstrate diffraction of the microwaves, remove the transmitting
horn from the end of the waveguide, and place a piece of aluminum foil
over the output end of the waveguide in which a slit has been cut of
width equal to 0.2 l.
Connect the coaxial line to the receiver, place the receiver at the 14
cm mark, and adjust the attenuator to give a meter reading of 60. Move
the receiver in an arc around the end of the waveguide and note the
meter readings.
Double-Slit Interference Interference between
coherent sources is illustrated as follows. Place the right-angle
waveguide bend and high-gain horn on the end of the waveguide so that
the horn faces toward the front of the board. Prepare from a good
reflector (aluminum foil, sheet metal) a sheet about one foot square
with a pair of slits in it which are one-half wavelength wide and
separated by a distance of two wavelengths measured from the center of
each slit. Secure this sheet to the end of the high-gain horn with the
slits vertical, taking care to center the slits in the aperature of the
horn. Place the receiver assembly on a tripod without the high-gain
horn and investigate the interference pattern by moving the receiver
horizontally across the transmitting horn.
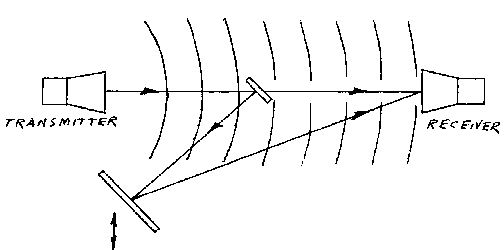
Interference Between Two Remote Sources Place a
high-gain horn on the end of the waveguide and on the receiver. Place
the receiver on a tripod at a distance of about 3 feet from the
receiver and at the same height. Place the small mirror into the
component stand in a vertical position and at a distance of about 6
inches in front of the transmitting horn, centered in the aperature of
the horn. Adjust the attenuator to give a meter reading of 80 without
the mirror in place, then insert the mirror and rotate it to an angle
such that the meter reading drops to 40.
Place
a large reflector (mirror or metal plate) about one foot square at a
position where it reflects the signal received from the small mirror
into the receiver. By observing the meter, one can tell when the signal
is being reflected into the receiver. When this occurs, the meter
reading will increase. By carefully moving the large reflector in the
direction of the arrow, the received signal can be observed to go
through a series of maxima and minima.
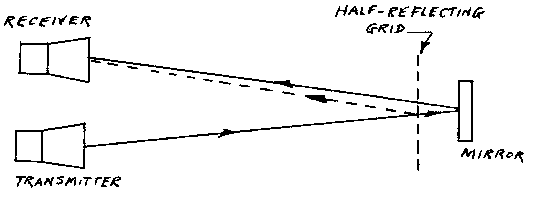
Thin Film Interference This demonstration requires
constructing a half-reflecting surface about one foot square from a
grid of wires. Make the separation between the wires about 1.2 x 1.2 cm. With
the small gain horns in place, and the coaxial cable connected to the
receiver, place the receiver alongside the transmitter on the board as
shown below. Place a mirror in the accessory stand and position it at
the 20 cm mark on the long scale. Maximize the meter reading by moving
the mirror perpendicular to the long scale. Now place the
half-reflecting grid in front of the mirror. By sliding the mirror
parallel to the long scale, a series of minima and maxima will be
observed corresponding to destructive and constructive interference
between the waves reflected from the two surfaces.
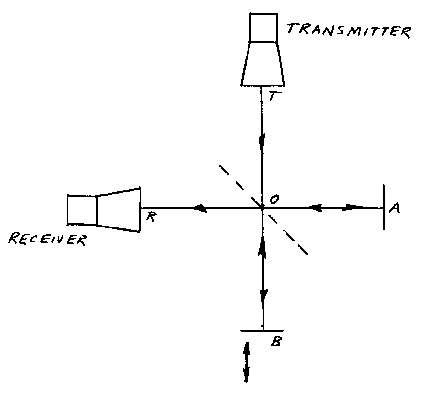
Michelson's Interferometer The operation of
Michelson's interferometer can be illustrated with the grid described
in experiment 26 and two polished aluminum sheets each about one foot
square. Distance in this experiment must be measured carefully. With
the high-gain horns attached to the transmitter and receiver, and the
coaxial cable connected to the receiver, place the receiver assembly on
a tripod. Using the two polished aluminum sheets as reflectors and
the half-reflecting surface described in experiment 26, arrange the
components as shown in the diagram below, the half-reflecting surface
midway between the receiver and reflector A and at a 45ş angle with the
direction of the incident radiation. The lines OA, OB, OT and OR all
are two feet long. Adjust the receiver laterally to obtain a maximum
signal and set the attenuator to give a meter reading of 50. By moving
the reflector B along the line OB, the meter will pass through a series
of maxima and minima. The distance between successive maxima or minima
is one-half a wavelength.
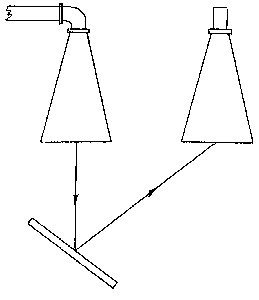
Operation of Radar One of the elementary principles
of radar can be demonstrated in the following way. Attach the right
angle bend to the transmitter and the high-gain horns to the
transmitter and receiver. Position them as shown in the diagram below,
using wood blocks to support the horns at the same level. Place a
reflecting body in front of the horns and thereby reflect microwave
energy into the receiver horn. Note the change in the meter reading. It
should be pointed out by the demonstrator that actual radar operation
requires a trigger circuit to determine the range of the reflecting
body.
Demonstration of Doppler The frequency shift due to
motion of the reflecting body relative to the receiver can be
illustrated using the set up described in experiment 28. Switch off the
internal modulation (audio) and move the reflecting body rapidly back
and forth. If no signal is received, rotate the Repeller Voltage
control until a meter indication results. (The Klystron is now
operating CW and this will require precise adjustment of the Repeller
Voltage). Note the resultant frequencies as a result of the fanning
motion of the reflector.
Weather Detection
The microwave properties of rain (water) can be demonstrated in the following ways. With
the small gain horns in place, position the receiver assembly at 22 cm
on the long scale and adjust the attenuator to give a meter reading of
80. Note the difference in meter indication when first a dry sponge and
then a damp sponge is inserted between the horns. Remove the sponge and
place an empty water glass between the horns. Because of the slight
focusing effect of the glass, move it back and forth along the scale to
obtain a maximum meter reading. Now fill the glass with water and note
the effect. Finally, set up the apparatus to observe reflections from
the wet sponge (experiments 1 and 2).
Microwave Relays When microwave energy is
transmitted through space, a continuous wave (CW) is sent from
transmitter to receiver. Without modulation, no information is
contained in this wave other than its frequency. To transmit
information, the klystron output must be modulated, such as with pulses
or with voice as in a microwave relay used in long distance telephone
transmission. To
illustrate voice modulation, insert a phone plug which is connected to
a voice coil into the jack marked EXT. MOD. (On some recorders and
phonographs, there is a output marked External Speaker. The modulation
can be taken directly from there rather than connecting to a voice
coil). Place the receiver alongside the long scale facing the
transmitter to produce an audio output. The volume can be controlled
either at the tape recorder or at the volume control on the set. Once
the audio is obtained, interrupt the path of transmission with a
non-transparent substance and note the effect.